
News
Direct answer: A line’s real output is good boards per hour, and it is set by the slowest station on that line, for that board, on that shift — not by the fastest number on any one machine’s datasheet. A placement machine’s rated speed is measured in components per hour under the maker’s own best conditions; a line’s output is measured in boards per hour under your conditions, after changeover, stops, board mix and rework have taken their share. To read a vendor’s throughput number honestly, ask which board it was measured on, which components, under what conditions, and whether it is a rated maximum or an IPC-9850 net throughput. To estimate a realistic number before promising a delivery date, time each station on your own board, take the slowest as the ceiling, then apply your own availability and first-pass yield from your own logs. Any boards-per-hour figure that skips those steps is a guess wearing a decimal point.
Every machine on an SMT line quotes a top speed. The printer quotes a cycle time, the placement machine quotes components per hour, the reflow oven quotes a conveyor speed, and the inspection machine quotes boards per hour. Add them up and the line should be fast. Run the line for a week and count the good boards that come out, divide by the hours the line was scheduled to run, and the number is always smaller — sometimes much smaller. Nobody is lying. The numbers are measuring different things, under different conditions, and none of them is the number a buyer actually needs.
The number a buyer needs is simple to state and hard to earn: how many good boards will this line produce per hour, running this board, this mix, with this crew, on a normal shift? This article explains how to read the numbers vendors publish, why the slowest station sets the line’s rate, which four losses eat most of the difference between rated speed and real output, and how to estimate a realistic figure before a delivery date is promised. It is written for the engineer, planner or buyer who has to commit to a date, not for the brochure.
One boundary first, so the rest of the article is read correctly. This article gives no boards-per-hour number as a standard for any line. Throughput depends on the board, the mix and the stops, and any single figure presented as “what a line produces” would be wrong the moment a different board is loaded. The worked examples below use round numbers chosen only to show the arithmetic, with their assumptions stated next to them. The method is the deliverable. The numbers are illustrations, and your line’s numbers will differ.
Most confusion about line throughput starts with three figures that sound interchangeable and are not. Keep them apart and half the arguments about speed disappear.
Rated speed, or maximum CPH. This is the placement machine’s headline figure, in components per hour. It is a peak measured under the maker’s own best conditions: a favourable board, favourable components, the fastest head configuration, and no interruptions. It answers the question “how fast can this machine place components when everything is in its favour?” It does not answer how many boards your line will produce, because it says nothing about your board, your mix, your changeovers or your stops. Two machines with the same rated speed can produce very different numbers of boards per hour on the same job, and a machine with a lower rated speed can out-produce a faster one on a high-mix line where changeover dominates. Rated speed is a ceiling for one station, not a promise for the line.
Net throughput, as defined by IPC-9850. The industry answered the rated-speed problem in 2002 with IPC-9850, Surface Mount Placement Equipment Characterization, a measurement procedure from the IPC SMEMA committee that gives every maker the same test to run. Its two definitions are the ones that matter here, and they are quoted from the standard’s text as published in a publicly mirrored copy of the standard, not from IPC’s own site.
Tact time is the average time needed to place one component while maintaining the stated process capability. It excludes board transfer time, fiducial reading and nozzle changes.
Net throughput is the number of components placed on the standard verification board per hour, calculated as the components on that board divided by the build time plus the transfer time, multiplied by 3,600. It is a components-per-hour figure, measured on a specified verification board — not on your board.
The difference between the two definitions is the point. Tact time leaves out transfer and setup work; net throughput puts the transfer time back in. A vendor figure that does not say which one it is, and on which board, cannot be compared with another vendor’s figure. Before IPC-9850, makers could inflate a headline speed by measuring nozzle movement in place, with no board moving at all — one well-known case put a machine’s claimed speed near four times what it achieved on a real board. The standard exists because the headline alone could not be trusted. It still cannot be, unless the figure is tied to the standard’s test.
Boards per hour. This is the only one of the three that a line actually delivers, and the only one a delivery date depends on. It is counted at the end of the line, in finished boards, per scheduled hour, after everything that slows the line has happened. It is not a machine specification. It is a property of the line, the board, the mix and the shift, and it has to be measured on your line, on your board, to mean anything. A placement machine’s net throughput can be converted into a boards-per-hour ceiling for the placement step alone — divide the net components per hour by the components on the board — but that ceiling is only one station’s ceiling. The line’s rate is decided by whichever station is slowest, which is the subject of the next section.
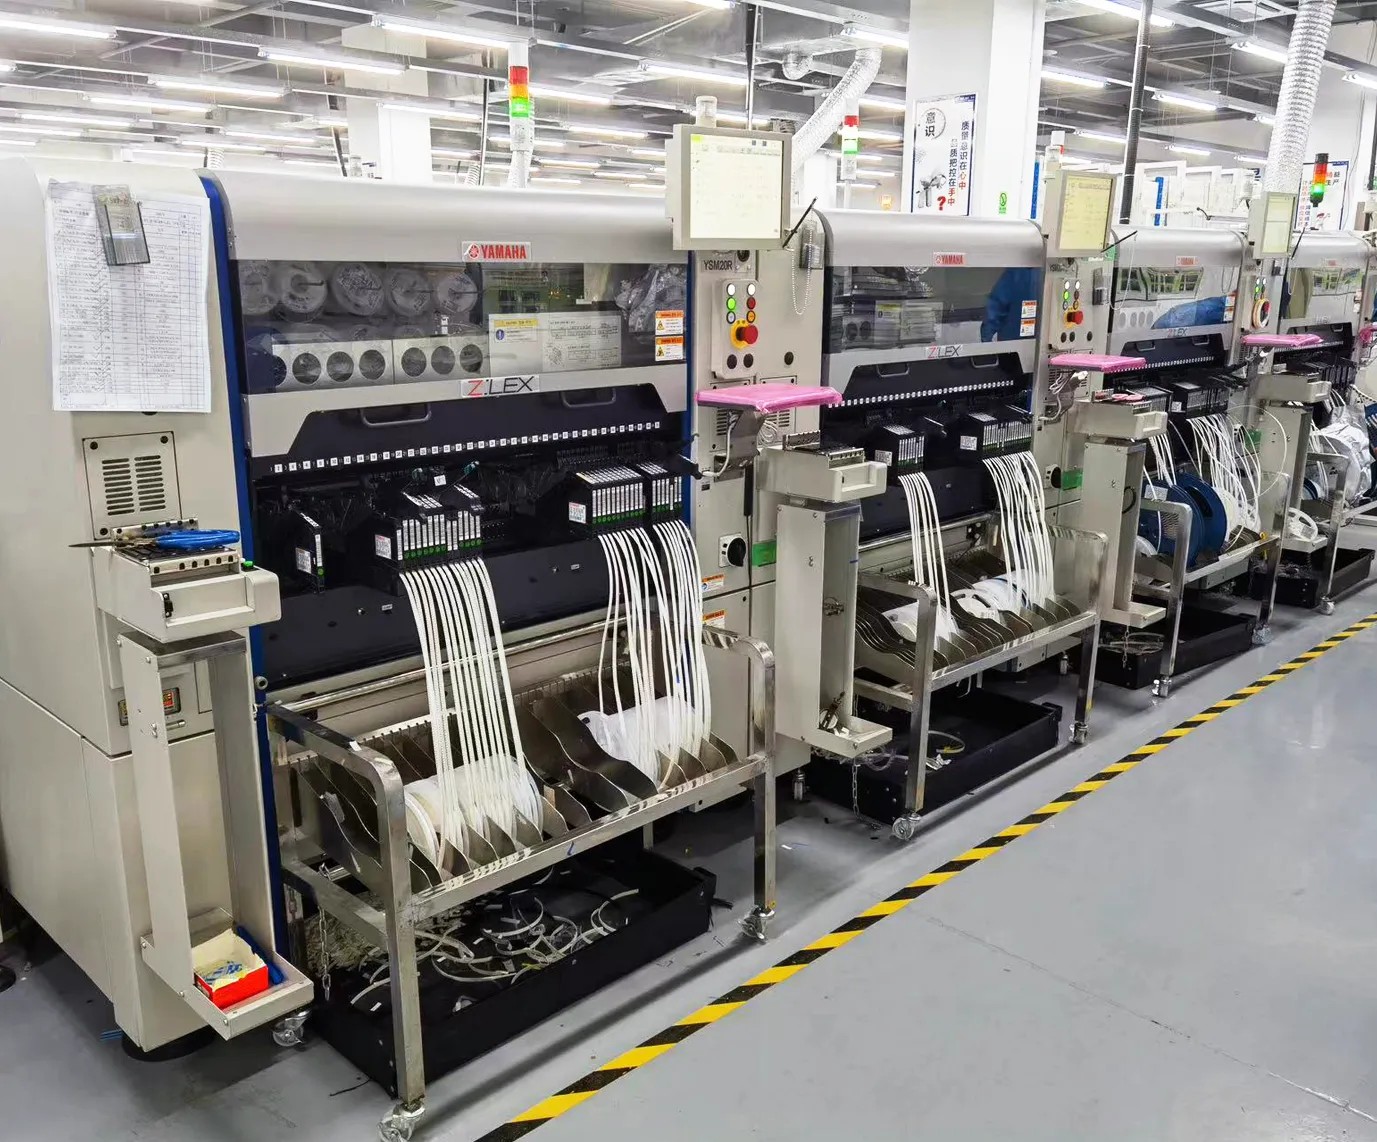
Three Yamaha YSM20R placement machines in a row on an SMT line, with tape feeder trolleys and component reels in front of each machine. The line’s output is set by the slowest station in this row, not by the fastest machine in it.
An SMT line is a chain of stations that must all finish their work on a board before the next board can move on. The printer prints, the placement machine places, the oven reflows, the inspection machine inspects. A board cannot leave the line faster than the slowest station in the chain can process it. This is the oldest rule in production engineering, and it is the one most often forgotten when a line is specified: adding a faster placement machine to a line whose printer is the bottleneck buys nothing, because the boards still leave the printer at the printer’s rate.
Finding the bottleneck is a measurement job, not an opinion. Time each station on your own board, from the moment a board enters the station to the moment it leaves, and write the times down. The longest time is the line’s cycle time for that board. The theoretical ceiling is 3,600 seconds divided by that cycle time in seconds. That ceiling is the fastest the line can go on that board if nothing ever stops — and something always stops, which is why the ceiling is only the starting point. Section 5 turns the ceiling into a realistic estimate.
One station needs care, because its timing works differently from the others. A reflow oven is a pipeline, not a single operation: boards travel through it on a conveyor, several at a time, so the oven’s transit time — the minutes a board spends inside — is not the oven’s cycle time. What limits the line at the oven is the entry pitch: how often a board can be fed in, which is set by the conveyor speed and the spacing between boards. An oven with a five-minute transit time can still accept a board every forty seconds. Counting the transit time as the oven’s cycle time would make the oven look like the bottleneck when it is not, and would hide the real one. The same pipeline logic applies to any station that holds several boards at once. Time the entry rate, not the residence time.
Worked example — arithmetic only, assumptions stated. Suppose a board is timed on a four-station line like this: the printer takes 25 seconds per board, placement takes 40 seconds, the oven accepts a board every 30 seconds, and inspection takes 20 seconds. The slowest station is placement at 40 seconds, so the line’s theoretical ceiling is 3,600 ÷ 40 = 90 boards per hour. The printer, the oven and the inspection machine all have spare capacity at that rate; speeding any of them up changes nothing until placement is faster than 40 seconds. Now suppose the same board is reprogrammed so placement takes 28 seconds, but the oven’s entry pitch is 30 seconds. The bottleneck moves to the oven, and the ceiling becomes 3,600 ÷ 30 = 120 boards per hour — not the 128 that placement alone would allow. The bottleneck moves when the board changes, the program changes, or the mix changes, which is why a bottleneck found once is not found forever. It has to be re-timed for each board, and re-checked when the mix shifts.
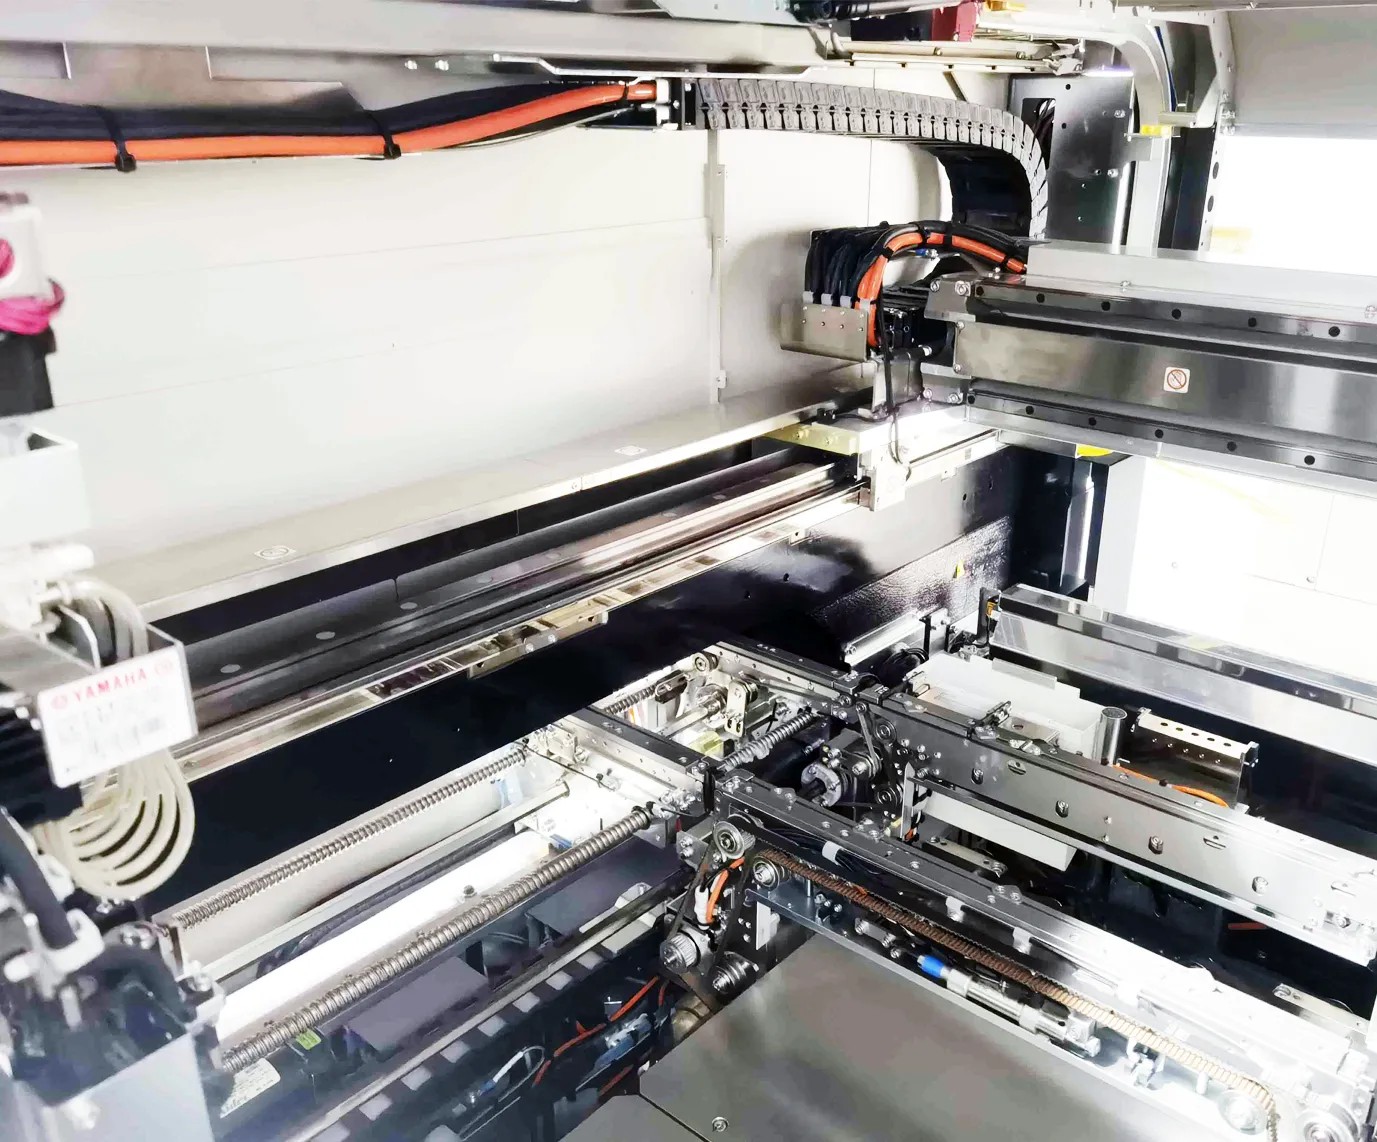
The board conveyor and gantry inside a Yamaha YSM20R placement machine. Every board enters through this conveyor, is placed, and leaves the same way — the time between boards here is part of the line’s cycle, not a footnote to it.
Board mix changes the bottleneck in a way that surprises buyers who sized a line for one board. A board with many small components loads the placement machine; a board with a few large or tall components loads the printer and the oven profile more than the placer; a board with heavy inspection requirements loads the inspection station. A line that runs one board type all week has one bottleneck. A line that runs ten board types a day has a bottleneck that moves with the schedule, and the day’s output is the sum of ten different ceilings, not one number times the hours. Feeder load matters the same way: a board that needs more feeder positions than the machine carries forces a feeder change or a split across two machines, and the change itself becomes the bottleneck for that batch. The placement machine’s rated speed says nothing about any of this, because rated speed is measured with the feeders already loaded and the program already running.
A throughput figure in a brochure or on a product page is not a lie and not a promise. It is a measurement made under conditions the seller chose, and the conditions are the whole content of the number. Five questions turn a headline into something usable. Ask them in writing, before the machine is bought, and keep the answers with the quote.
Which board was it measured on? A verification board with a few hundred identical small components flatters a placement machine. Your board, with mixed component sizes, fine-pitch parts, tall parts and a crowded layout, does not. IPC-9850 net throughput is defined on a specified verification board precisely so that different machines can be compared on the same board — but the verification board is still not your board. A figure measured on the verification board tells you how machines compare. It does not tell you what your board will do. Ask for the board definition behind the number, and treat a figure with no board behind it as a headline, not a measurement.
Which components, and how many? Components per hour depends on what is being placed. Small chips place fast; large or odd-shaped parts place slowly, need different nozzles, and may need a vision check that a small chip does not. A machine rated at its best with one component type will be slower on a board that mixes many types. Ask how the number changes across the component mix on your own bill of materials, not on the maker’s favourite mix.
Under what conditions — maximum, or IPC-9850 net? A “maximum CPH” figure is a peak under ideal conditions. An IPC-9850 net throughput figure is a measurement under a defined test, with transfer time included. The two can differ by a wide margin on the same machine, and the gap is not a rounding error: it is the transfer, fiducial and nozzle-change time that the peak leaves out. When two vendors’ numbers are compared, check that both are the same kind of number. Comparing one vendor’s maximum with another’s net throughput is comparing a sprint with a marathon.
Which head, and how many? A modular placement machine’s speed depends on its head configuration: the number of heads, the number of nozzles per head, and whether the configuration quoted is the one you would actually buy. A figure quoted with the fastest head on the fastest configuration is not the figure for the configuration in your quote. Ask for the number tied to the exact configuration being priced, and ask what changes if a head is added or removed later.
What was left out? The honest question, and the one that catches most inflated figures. Was board transfer included? Fiducial reading? Nozzle changes between component types? Was the machine running a real program, or a loop of identical placements? Was the number measured over an hour of continuous running, or extrapolated from a few seconds of best-case motion? A throughput number measured over a minute and multiplied by sixty is not an hourly rate; it is a minute with ambition. The only number that settles the question is a timed run of your own board, on the machine you are buying, for long enough to include the ordinary interruptions. If the vendor will not run your board, the brochure number is all you have, and it should be discounted accordingly.
The gap between a line’s theoretical ceiling and its real output is not one loss. It is four, and they behave differently, which is why they need to be measured separately instead of lumped into a single discount.
Changeover. Every product change costs the line its running time: the old feeders come off, the new ones go on, the program changes, the first board is checked. On a high-mix line running small batches, changeover can be the largest single loss, larger than any machine’s speed difference. A line that changes over four times a day loses four changeovers’ worth of output before a single board is counted, and a faster placement machine does not recover any of it. Our guide to changeover cost measures this loss in five clocks and shows how to spread it across the batch; this article takes its result as given and does not repeat its tables.
Stops. The line stops for reasons that have nothing to do with its rated speed: a feeder mis-picks, a reel runs out, a board jams, a sensor faults, an operator is away. Some stops are seconds, some are an hour, and the long ones dominate the loss. A line that stops for ten minutes every hour has lost a sixth of its output, whatever its machines can do when they run. The only way to know which stops matter is to log them by cause, with the time each one cost, instead of remembering the dramatic ones and forgetting the frequent small ones. Our guide to logging downtime gives the cause codes and the log format; the log it produces is also the data this article’s estimate in Section 5 is built on.
Board mix and feeder load. A line sized for one board type will run slower on a mix, for the reasons in Section 2: the bottleneck moves, feeders change, programs change, and the crew spends more of the shift setting up than producing. This loss is often misread as a machine problem — “the placer is too slow on this board” — when it is really a scheduling problem: the batch sequence, the feeder sharing between jobs, and the number of changeovers the day’s mix forces. Sizing a line for the average board and then running the hardest board is how a line ends up short on its busiest week.
Quality and rework. A board that fails inspection is not output, however fast it was placed. Rework consumes the line twice: once to build the board, and again to fix it, and the fixing often happens on the same stations that should be building the next good board. The quality loss belongs in the throughput estimate as first-pass yield — the share of boards that pass first time — not as an afterthought. Our guide to reading OEE treats availability, performance and quality as three separate ratios that multiply together; this article uses the same idea for boards per hour, and does not rewrite its formula here.
One more loss is often missed because it is not a machine at all: people. A line that needs two operators and has one will stop whenever the one operator is away, however fast the machines are. Our guide to line staffing works out how many people a shift actually needs; the throughput estimate below assumes that staffing is in place, and if it is not, the estimate is wrong before it starts.
A delivery date is a promise about boards per hour, whether it is stated that way or not. The estimate below is a six-step method. It takes an afternoon the first time and an hour once the logs exist, and it produces a number that can be defended to a customer, because every input in it comes from your own line rather than from a brochure.
Step 1 — Time each station on your board. Run the board, time each station from board-in to board-out, and write the times down. Do it for the board you are promising, not for the board that runs best. If the job is a mix, time each board type and keep them separate.
Step 2 — Take the slowest station as the ceiling. Theoretical boards per hour = 3,600 ÷ the slowest station’s seconds per board. Remember the oven rule from Section 2: use the entry pitch, not the transit time. This is the fastest the line can go, and the estimate only goes down from here.
Step 3 — Subtract changeover. Take the changeovers the schedule actually requires for this job, in minutes, and spread them across the batch. A batch of 200 boards with two 30-minute changeovers loses an hour of running time before the first board is counted. Small batches suffer most; a batch of 50 boards with one 30-minute changeover loses more, proportionally, than a batch of 2,000 with the same changeover.
Step 4 — Apply your own availability. Availability is the share of scheduled time the line actually runs, and it comes from your downtime log, not from a guess. If the log shows the line ran 85% of scheduled time last month, use 85% — and use the log for this product family, not the factory average, because a new board stops more often than a mature one. The downtime log is the source; without it, this step is a guess, and the estimate should say so.
Step 5 — Apply your own first-pass yield. Multiply by the share of boards that pass inspection the first time. A board that fails and is reworked is not output on the first pass, and the rework consumes station time that the estimate has already counted as production time.
Step 6 — Check the estimate against a measured week. Count the good boards that actually left the line last week and divide by the scheduled hours. If the estimate is far above the measured number, the estimate is wrong, not the measurement — go back and find which loss was underestimated. A common surprise is changeover: the schedule shows two changeovers and the line did five, because a feeder fault forced an unplanned one. The measured week is the truth the estimate has to match. When the two agree within a few percent, the estimate can be trusted for the next promise.
Worked example — arithmetic only, assumptions stated. Suppose a board is timed at 45 seconds at its slowest station, so the ceiling is 3,600 ÷ 45 = 80 boards per hour. Suppose the downtime log for this product family shows 85% availability, and first-pass yield is 98%. The realistic estimate is 80 × 0.85 × 0.98 = 66.6, call it 67 good boards per hour. The gap between 80 and 67 is not pessimism; it is the measured cost of stops and rework on this line. And the changeover in Step 3 sits outside this calculation: if the job is a batch of 200 boards with a 30-minute changeover, the batch needs 200 ÷ 67 ≈ 3 hours of running time plus the half-hour changeover, call it three and a half hours, before the delivery time is quoted. Quote three hours and the line is late before it starts.
What this estimate does not do. It does not predict a new board. A board the line has never run has no downtime log and no first-pass yield, so its estimate rests on the closest board the line has run, with a margin stated openly. It does not cover a line that is being changed — a new machine, a new feeder system, a new crew — because every input in the estimate belongs to the old line. And it does not survive a schedule change: add a second board type to the day and the bottleneck moves, the changeovers multiply, and the estimate has to be redone.
The honest way to quote a date for a board the line has never run is to say so, and to quote a range until the first batch has been timed. A range with a stated basis is more useful than a single number with none.
Inflated throughput figures are rarely invented. They are usually true numbers used in the wrong place. The five patterns below cover most of them, and each one has a simple test.
| The inflation | How it happens | How to spot it |
|---|---|---|
| Maximum CPH as line rate | A placement machine’s rated peak is divided by the components per board and presented as the line’s boards per hour. | Ask whether the figure is a maximum or an IPC-9850 net throughput, and on which board. A peak is not a sustained rate. |
| Transfer time left out | The cycle is timed from first placement to last placement, with board loading, fiducial reading and nozzle changes excluded. | Ask for board-in to board-out timing. IPC-9850 net throughput includes transfer time for exactly this reason. |
| The cherry-picked board | The number comes from the easiest board in the catalogue: few components, all small, all the same. | Ask for the number on your board, with your mix. A figure with no board behind it is a headline. |
| Changeover ignored | The rate is quoted per running hour, and the hours lost to changeover are never subtracted. | Ask for boards per scheduled hour, not per running hour, on a batch of your size. |
| Boards started, not good boards out | Every board that enters the line is counted, including the ones that fail inspection and go back for rework. | Ask for first-pass yield alongside the rate, and count only boards that pass. |
A number that survives all five tests is not necessarily the number your line will achieve — it is a number that was measured honestly, on a defined board, under stated conditions. That is the most any vendor figure can be. Your line’s number still has to be measured on your line.
A placement machine’s rated speed decides one thing: the ceiling of the placement station. It does not decide the line’s output, and it does not decide whether the placement station is even the bottleneck. Take the Yamaha YSM20R as an example. Its rated speed is listed at 95,000 components per hour, under Yamaha’s own optimal conditions with twin high-speed multi heads, as listed on the JHIMS YSM20R product page and on Yamaha’s own specifications. That figure is a rated number for the placement station under the maker’s best conditions. It is not a boards-per-hour figure for any line, and it says nothing about the printer, the oven, the inspection station, the changeovers or the stops on the line the machine will join.
Used correctly, the rated speed is still useful. It tells a buyer how machines compare on placement capacity, it sets the ceiling for the placement step in the Section 5 estimate, and it shows whether placement is even a candidate for the bottleneck: if the rated ceiling is far above the line’s slowest station, placement is not the problem, and a faster placement machine will not help. Used incorrectly — divided by the components per board and quoted as the line’s output — it produces a number that looks precise and is wrong, because it treats a rated peak as a sustained net rate, ignores transfer time, and assumes placement is the bottleneck. The machine’s own page and the YSM20R product page on jhims.com list the rated figure with its conditions; the conditions are part of the figure, and a buyer who quotes the figure without them is quoting half a specification.
The same caution applies to every machine on the line. A printer’s cycle time, an oven’s conveyor speed and an inspection machine’s boards-per-hour rating are each a single station’s ceiling, measured under that maker’s conditions. None of them is the line’s output. The line’s output is the slowest of them, on your board, after the four losses in Section 4. Buying a faster machine at a station that is not the bottleneck is the most expensive way to learn this.
A throughput promise is only as good as the conditions written next to it. Before signing, ask for the answers in writing, tied to your board, and keep them with the order. Eight questions cover it.
1. What is the IPC-9850 net throughput for this machine, and on which verification board was it measured? 2. What is the maximum CPH, and what conditions make it the maximum rather than the net figure? 3. What boards-per-hour rate do you guarantee for our board, with our component mix, and over what period is it measured? 4. Does that rate count scheduled hours or running hours, and are changeovers included? 5. What first-pass yield is assumed, and what happens to the rate if yield is lower? 6. Which head and nozzle configuration is the quoted figure tied to, and what does the figure become with the configuration we are buying? 7. Will you run our board on the machine before we sign, and time it board-in to board-out? 8. What happens if the machine does not reach the quoted rate on our board during acceptance — and who pays for the retest?
The last question is the one that separates a figure the vendor stands behind from a figure in a brochure. A vendor who will run your board and accept a rate tied to it is selling a measured capability. A vendor who will not is selling a headline. Our guide to reading a turnkey line quote covers what else a quote should contain and what it often hides; the eight questions above belong in that quote, next to the price, before it is signed.
Can I convert a machine’s CPH into boards per hour by dividing by the components on my board?
Only as a ceiling for the placement step, and only with the net throughput figure, not the rated maximum. Divide the IPC-9850 net CPH by the components on the board and you get the fastest the placement station could feed boards, before transfer time, other stations, changeover, stops and rework. The line’s real rate is that ceiling or lower, never higher.
Our line has a faster placement machine than our competitor’s, but we produce fewer boards. Why?
Because the placement machine is probably not your bottleneck. Time each station on your board. The slowest station sets the rate, and on many lines it is the printer, the oven’s entry pitch, inspection, or the changeover between jobs — none of which a faster placement machine improves. Measure first, then decide what to upgrade.
Should I use the vendor’s throughput number or measure my own?
Both, in that order. Use the vendor’s number, with its conditions attached, to compare machines before buying. Then measure your own line, on your own board, with your own logs, and use the measured number to promise delivery dates. A vendor number used for a delivery promise is a guess with a logo on it.
Does OEE already answer this question?
It answers the ratio version of it: how efficiently the line ran compared with its own ceiling. Boards per hour is the absolute version: how many good boards actually left the line. The two need each other — OEE tells you where the losses are, boards per hour tells you what the customer gets — but one does not replace the other. Our OEE guide covers the ratio; this article covers the absolute number.
We run ten different boards a day. Is there even a single throughput number for our line?
No, and pretending there is one is how delivery dates go wrong. Each board has its own bottleneck, its own ceiling and its own losses. Estimate per board, then add the boards up across the day’s schedule, with the changeovers between them. A single average hides the day’s hardest board, which is the one that makes the line late.
A line’s real output is good boards per hour, measured at the end of the line, on your board, on a normal shift. It is set by the slowest station, reduced by changeover, stops, board mix and rework, and it has to be measured on your line to be trusted. A vendor’s throughput number is a useful comparison tool when its conditions are attached — which board, which components, maximum or IPC-9850 net, which head configuration — and a misleading one when they are not. Estimate from your own timed stations, your own downtime log and your own first-pass yield, check the estimate against a measured week, and quote the date from the estimate, not from the brochure. The line will still surprise you sometimes. It will surprise you far less often than a number that was never measured.
To discuss throughput for your board and line, or for the rated specifications of the placement machines in this article, contact JHIMS at [email protected].


 Teams
 whatsapp
 telegram
