
News
Direct answer: A downtime log is one line per stop: when it started, which station stopped, how long it lasted, which of about twelve reason codes it was, and one line of free text. Planned time — scheduled maintenance, breaks, and time with no orders — is not downtime and never enters the log. Changeover is logged as downtime, because the line was scheduled to produce and did not. After one week, sort the codes by total minutes lost, not by number of events: the two or three codes at the top are the fix list. The first week’s log is the line’s own baseline — there is no universal “good” downtime percentage to compare it against, and the biggest cause on your line is whatever the log shows, not whatever the loudest breakdown felt like.
Every SMT line stops. Feeders jam, a reel runs out mid-board, a nozzle misses a pickup, the printer waits for boards, the oven waits for the line. The stops themselves are normal. What is not normal is finishing a shift and having no answer to the simplest question in the factory: where did the hours go? Ask three people and you get three answers. The operator remembers the breakdown that took forty minutes. The shift lead remembers the changeover that ran long. The production manager remembers the morning when nothing seemed to run at all. All three are remembering something real, and none of them is the answer — because the answer is a count, and nobody counted.
This article explains how to count. It is a method for logging SMT line downtime on paper or in a spreadsheet, with no software to buy and no machine to install. It covers what counts as a stop, which reason codes to use, who writes what down and when, and how one week of lines turns into a ranked list of what to fix first. It also covers what the log cannot do, and where its limits are — because a log that pretends to measure everything ends up measuring nothing.
One boundary first, so the rest of the article is read correctly. This is a logging method, not a diagnosis guide. Individual stop causes — a feeder that jams, air pressure that drops, a nozzle that wears — each have their own causes and fixes, and other guides already cover them. This article does not re-diagnose any single cause. It records all of them in one place, in the same format, so the line can see which one is actually eating its output. That distinction matters: a log tells you where to look. It does not tell you what is wrong.
Picture a normal eight-hour shift on a small SMT line: printer, placement machine, reflow oven, inspection. The line runs, stops, runs again. At the end of the shift the board count is short of plan by, say, a hundred boards. The shift lead writes “machine stops” in the shift report and moves on. That sentence is true and useless. It does not say which machine stopped, how many times, for how long, or why. Without those four facts, the next shift repeats the same stops, and the week ends with the same shortfall and the same sentence.
The usual substitute for a log is memory, and memory has a known bias: it remembers the dramatic stop and forgets the routine ones. A single breakdown that stops the line for forty-five minutes is memorable. Forty feeder jams of one minute each are not — each one is cleared, forgotten, and repeated. But forty-five minutes is forty-five minutes either way, and the forty jams add up to forty. A log exists to correct exactly this bias. It replaces what the shift felt like with what the shift added up to.
The second reason a log matters is that it is the raw material for everything else the line measures. The availability side of OEE — the calculation this log feeds — is built from the same minutes this log records. Our companion guide on reading OEE explains the calculation itself; this article is about producing the numbers that go into it. A stop that is never written down never appears in any factor, so the OEE number looks better than the line actually ran. The log is what keeps the calculation honest. The same applies to the shift handover: the next shift needs to know which stops already happened and why, and the log is where those stops are first written down.
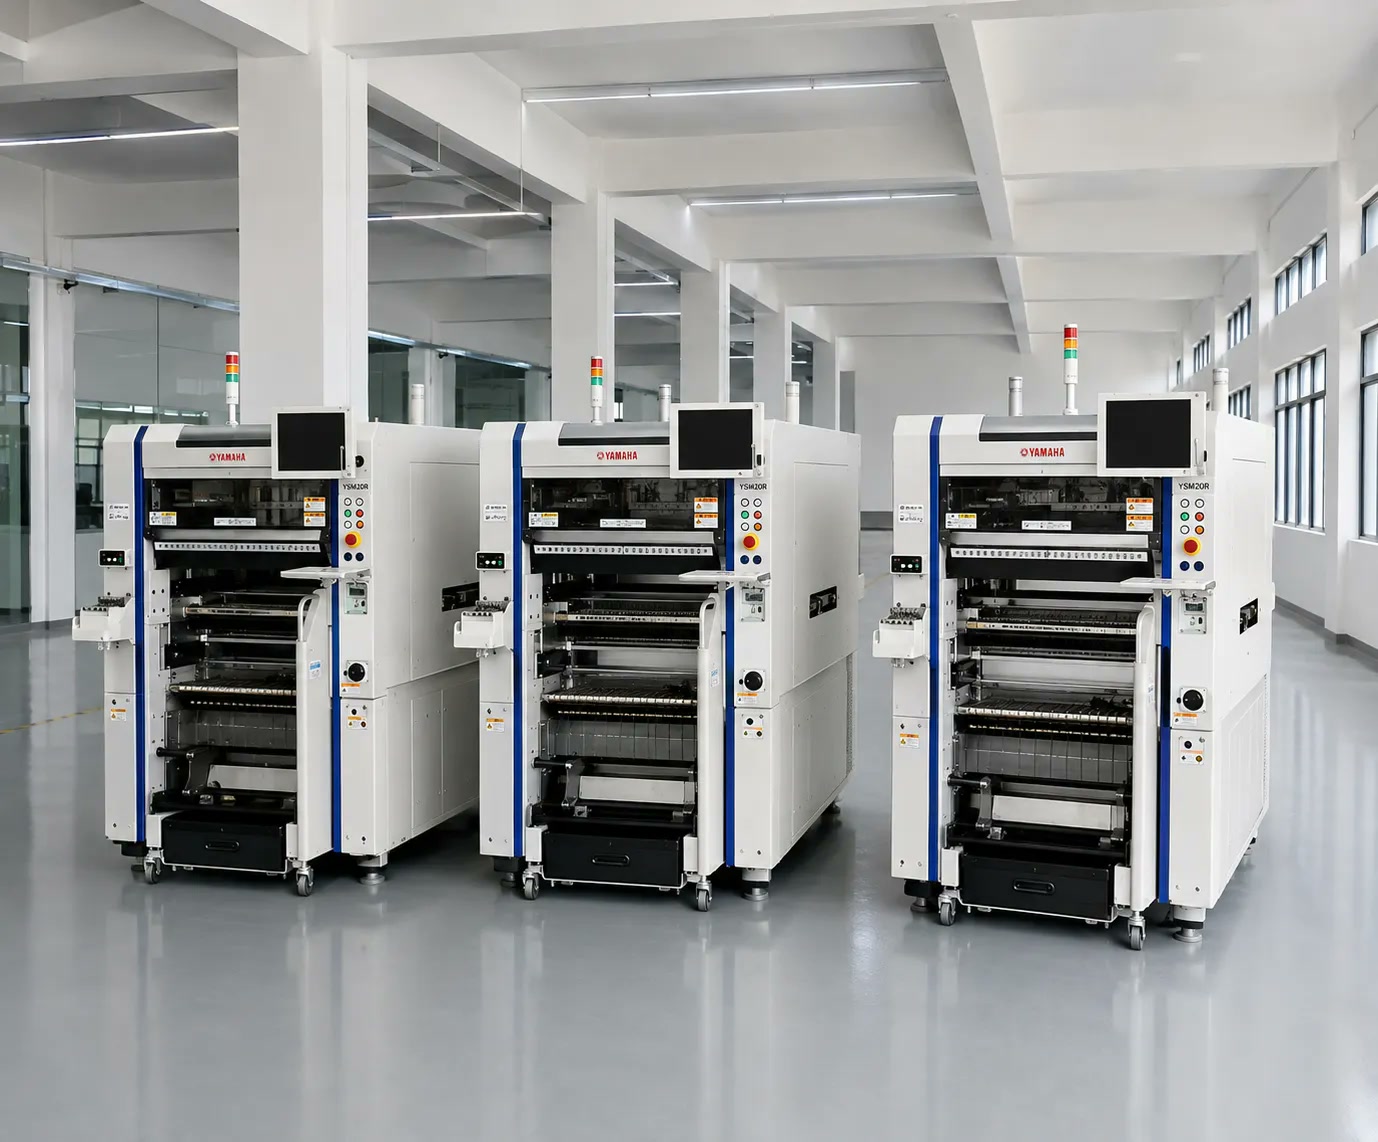
Three Yamaha placement machines in a warehouse. Once a line like this is running, every stop it makes is either logged — or lost.
A log is only as good as its boundary, and the boundary has to be written down once and then never moved from shift to shift. If one operator logs a changeover as downtime and the next one does not, the week’s numbers cannot be compared with each other, and the Pareto at the end of the week is fiction. So the first decision is not which codes to use. It is what counts.
The definition used in this article follows the standard time model behind OEE (ISO 22400): downtime is time inside planned production time when the line is not producing good boards at its normal rate. Planned production time is the time the line was scheduled to make product. Everything outside it — weekends, holidays, unstaffed shifts, time with no orders — is not downtime, because the line was never supposed to run then. Inside planned production time, the split is between planned and unplanned stops:
| Type | What it covers | Logged as downtime? |
|---|---|---|
| Planned, not production | Scheduled maintenance, scheduled breaks, planned meetings, no-demand time | No. This time is taken out of planned production time before the log starts. Scheduled maintenance is planned time, not downtime — charging it as downtime would penalise the maintenance the line needs. |
| Unplanned — availability loss | Breakdowns, feeder jams, nozzle and pickup errors, waiting for boards or material, quality holds, operator absence | Yes. One line per stop, with a reason code. This is the log’s main subject. |
| Changeover and setup | Changing feeders and program, first-piece adjustment and approval after the change | Yes. This is the boundary case everyone argues about, and this article takes the standard TPM position: the line was scheduled to produce and did not, so the changeover is an availability loss. What matters is that the rule is written down and never changed mid-week. Our changeover guide covers how to shorten this time; the log only records it. |
| Micro-stops | Stops of a minute or two: a single jam cleared at once, a sensor wiped, a board re-seated | In aggregate, not one line each. Logging every thirty-second stop as its own line would bury the operator in paperwork and the log would die within a day. Instead, tally micro-stops of the same cause with a tick mark and total their minutes once per shift. Their full weight shows up in the performance side of OEE, which is the right instrument for them — the log’s job is to catch them in total, not one by one. |
Two rules follow from this table. First, the boundary is decided before the first line is written, and it is printed at the top of the log sheet so every shift uses the same one. Second, planned maintenance is never logged as downtime — it belongs to the maintenance calendar, which schedules the checks that keep the line running. Our maintenance calendar guide covers that schedule; this article covers the unplanned stops that happen between those checks. Mixing the two makes both numbers meaningless: the calendar looks as if it is failing, and the log looks as if the line is worse than it is.
One more point on scope. This log records stops on one line. If the factory has three lines, each line keeps its own log. Combining lines into one sheet hides the line that is actually struggling behind the two that are running well, and no Pareto can tell you which line to walk to first.
The second decision is the reason-code list, and the rule for it is simple: an operator must be able to pick the right code in about five seconds, standing at the machine. A list of thirty codes fails that test — the operator stares, guesses, or picks the first one. A list of four codes fails the other way: everything becomes “machine fault” and the Pareto at the end of the week has one bar. Twelve codes, in four groups, covers most SMT lines. Every code maps to a different owner or a different fix; if two codes always lead to the same person doing the same thing, merge them.
| Group | Code | What it means | Owner |
|---|---|---|---|
| Equipment | Breakdown — mechanical | Physical failure: belts, bearings, drives, tooling breakage | Maintenance |
| Breakdown — electrical / controls | Drives, sensors, PLC faults, alarms that need reset and investigation | Maintenance / controls | |
| Nozzle / pickup error | Missed or dropped pickups, nozzle errors that stop placement | Operator / maintenance | |
| Feeding & material | Feeder jam / misfeed | Tape jammed or misfed in the feeder; feeder not picking correctly | Operator |
| Reel change / splice | Unscheduled reel change or tape splice mid-batch | Operator | |
| Waiting for boards / material | Line starved: no boards, no components, no paste, no program | Production planning | |
| Changeover & setup | Changeover / setup | Feeder and program change from last good board of job A to first good board of job B | Production |
| First-piece adjustment & approval | Dial-in and waiting for first-piece inspection after setup | Production / quality | |
| Process & other | Inspection / quality hold | Line held for inspection results, rework decision, or a quality stop | Quality |
| Compressed air / utilities | Air pressure, power, or other utility interruption | Facilities / maintenance | |
| Operator unavailable / handover gap | No operator at the line: absence, break overlap, handover delay | Shift lead | |
| Other — with a note | Anything that fits no code above; the note is mandatory, not optional | Shift lead |
The “Other” code is the safety valve, and it has a rule of its own: if “Other” grows past roughly a tenth of the lost minutes in a month, the notes get read and the recurring cause gets promoted to its own code. A code list that never changes is a list that stopped describing the line. A new recurring cause — a stencil that needs cleaning twice a shift, a conveyor sensor that faults every humid morning — earns its own code the week it shows up twice in the notes, and the list is reprinted.
Note what is not in the list: there is no code for “operator error” and no code for blame. A stop caused by a wrong feeder setup is logged under the code for what stopped the line — feeder jam, or changeover — not under who did it. The moment the log becomes a record of who to blame, operators stop writing in it, and the line goes back to guessing. The log records the line, not the people.
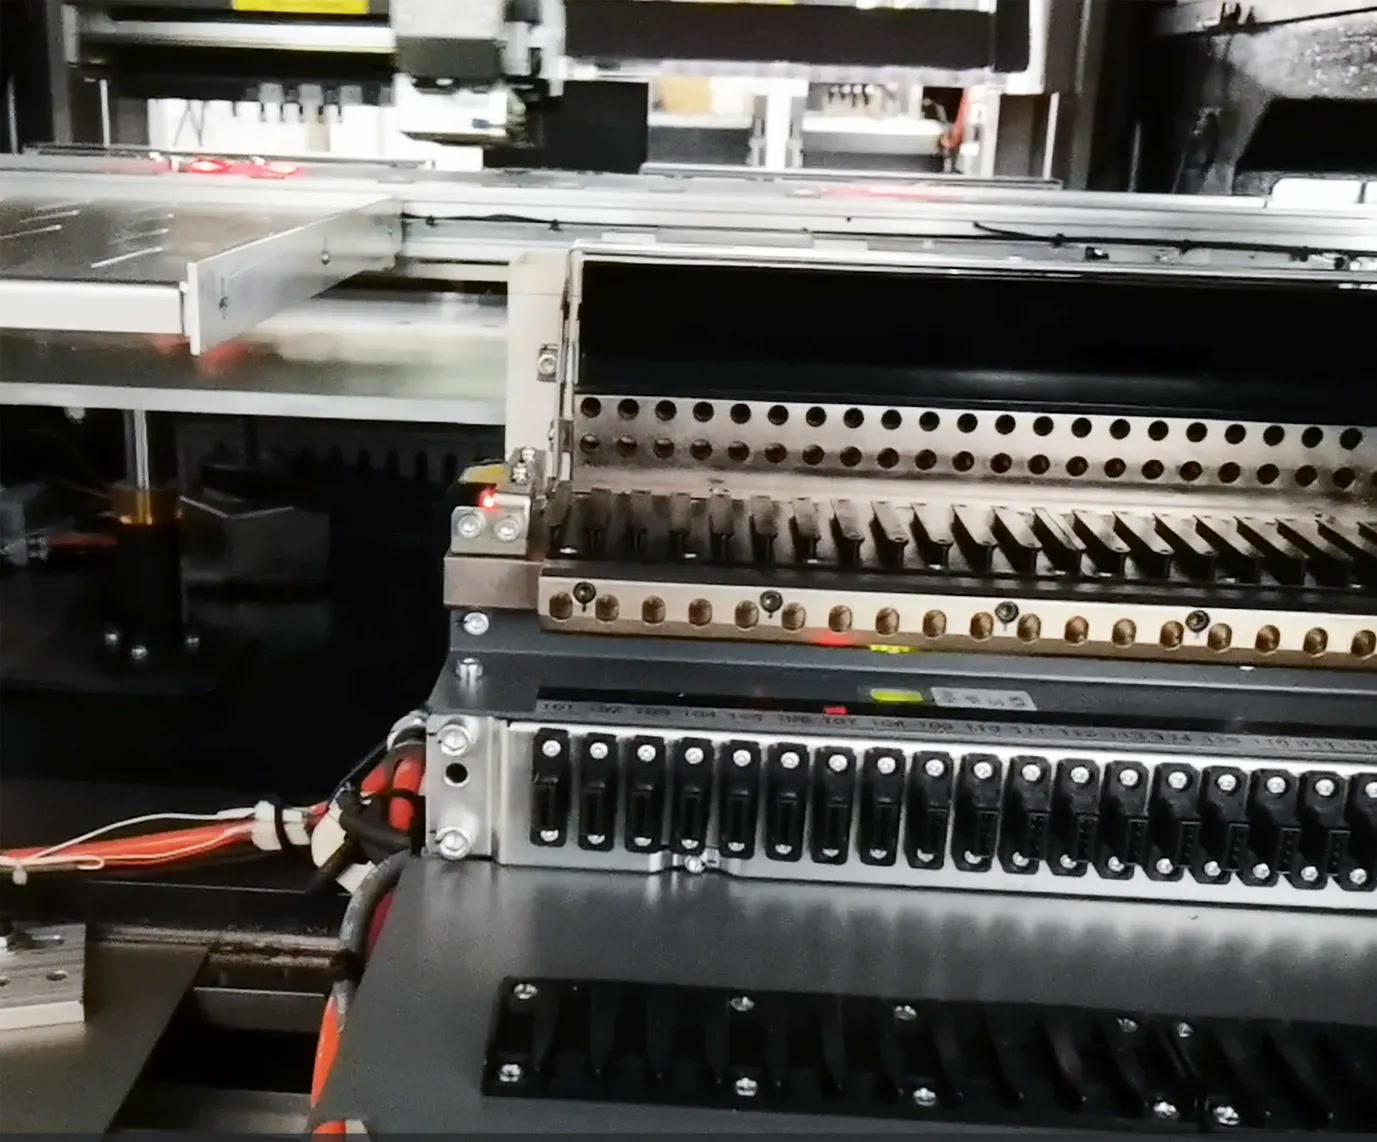
A feeder bank on a YSM10 placement machine: tape feeders slotted side by side. Feeder jams are one of the most common stop codes in the log — and the easiest to undercount, because each one only takes a minute to clear.
A log that is filled in at the end of the shift is a reconstruction, and reconstructions lose the short stops and round everything to the nearest quarter hour. The rule is: log at the machine, at the time of the stop. The operator who clears the stop writes the line, while the stop is still happening or the moment the line restarts. That is the whole discipline, and it is the difference between a log and a guess.
Each line carries seven fields — no more, because a form with fifteen fields does not get filled in on a running line:
One log line, seven fields:
1. Date and shift — which day, which shift.
2. Station — printer, placement machine, oven, inspection, conveyor.
3. Start time — when the line stopped, taken from the machine’s own display or alarm message, not from memory.
4. End time — when the line restarted. Duration is end minus start; nobody estimates durations.
5. Reason code — one of the twelve, picked in five seconds.
6. One line of free text — feeder 12, reel 0402 10k, nozzle 3, board stuck at oven exit. Enough for the next shift to find the same thing again.
7. Who logged it — initials, so the shift lead knows whom to ask when a line is unclear.
The start and end times deserve emphasis, because they are where most paper logs quietly fail. Two clocks that disagree by five minutes — the wall clock and the machine display — will produce a week of durations that are all slightly wrong in the same direction. Pick one clock and use it for every line: the machine’s own display is the natural choice, because its alarm message already stamps the moment the stop began. If the line has no display that shows the time, the wall clock by the line is the standard, and it is written on the sheet. What is never acceptable is estimating the duration after the fact — “about ten minutes” written an hour later is not data.
Paper or spreadsheet is a practical question, not a philosophical one. Start on paper, clipped to the line, one sheet per shift. Paper works when the network does not, it needs no login, and it is in front of the operator at the moment of the stop. Once per shift — at handover, not at the end of the week — the shift lead transfers the sheet into a spreadsheet, one row per line, and the paper sheet is filed. The spreadsheet is where the week’s totals are calculated; the paper is where the stops are caught. A factory that starts with a tablet app usually discovers the same thing within a month: the app is fine, but the discipline is the same, and the discipline is what was missing.
Ownership is split three ways. The operator logs the stops — that is the only part that cannot be delegated, because only the operator is standing at the machine when it stops. The shift lead checks the sheet at handover: every stop has a code, every duration is end minus start, no line is blank. The line manager or engineer owns the weekly review, which is the subject of the next section. Our guide on how many operators a line actually needs covers who stands at the line; this article covers what those people write down while they are there.
The payoff of the log comes once a week, and it takes about twenty minutes. Add up the minutes for each code, sort the codes from most minutes to fewest, and draw the ranking. That is a Pareto chart, and its only rule is that it ranks by total minutes lost — not by the number of events. Ranking by event count would crown the feeder jam that happened forty times for one minute each, and bury the changeover that happened six times for forty minutes each, even though the changeover cost more. Minutes are the currency; events are only the count of coins.
The table below shows the method on an illustrative week. These numbers are made up, to show how the ranking works — they are not data from any real line, and no real line should expect its own numbers to look like these:
| Rank | Reason code | Events | Total minutes | Share of lost time |
|---|---|---|---|---|
| 1 | Feeder jam / misfeed | 42 | 310 | 31% |
| 2 | Changeover / setup | 6 | 240 | 24% |
| 3 | Waiting for boards / material | 9 | 180 | 18% |
| 4 | Nozzle / pickup error | 18 | 120 | 12% |
| 5 | Breakdown — mechanical | 1 | 90 | 9% |
| 6 | Other | 4 | 60 | 6% |
| Total lost time, illustrative week | 1,000 | 100% | ||
Read the table the way the weekly review should read it. The single breakdown lasted ninety minutes and is the stop everyone remembers from that week — it ranks fifth. The feeder jams, forty-two of them, cost more than three times as much and rank first. The changeover happened only six times and still took nearly a quarter of the lost time. The top three codes together own almost three quarters of the loss. That is the shape a Pareto usually takes: a small number of codes cause most of the lost minutes, and the rest is a long tail. The exact split varies by line — that is the point of logging it instead of assuming it.
The review itself has a fixed agenda, and it is short. The top three codes each get a named owner and one action, written down with a date. The action for the top code is the only project that matters that week; the second and third get smaller actions, or a date to look again. The rest of the list is watched, not worked on. Then the log continues, and next week’s Pareto shows whether the action moved the bar. Data that visibly drives action is data people keep entering; data that is collected and never reviewed stops being entered within a month.
This is also how the log answers the question in the title — how to tell a one-off jam from the bottleneck that is actually eating output. A one-off is a single long event: the ninety-minute breakdown, dramatic, rare, and usually already understood. A bottleneck is a pattern: the same code, week after week, adding up to the largest pile of minutes. Frequency times duration is the test. One long stop is an incident. Forty short stops with the same code are a system, and systems are what the log exists to find.
Most downtime logs do not fail because the method is wrong. They fail in one of five familiar ways, and all five are avoidable if they are named in advance.
1. Reconstructing the shift from memory. The sheet is filled in at the end of the shift, from what the operator remembers. The short stops vanish, the durations round up to fifteen minutes, and two operators reconstruct the same shift differently. The fix is the rule from Section 4: log at the machine, at the time.
2. Hiding stops inside “planned” time. A changeover that ran long gets written off as planned, a breakdown during a break never gets logged, a slow morning is called a warm-up. Every minute moved into planned time makes the availability number look better and the line look healthier than it is. The fix is the boundary table in Section 2, printed on the sheet and never moved.
3. Too many codes, or codes nobody can tell apart. The list grows to twenty-five codes, two of which mean nearly the same thing, and operators start picking at random. The Pareto then ranks a coin toss. The fix is the five-second test: if the operator cannot pick the code in five seconds, the list is wrong.
4. Collecting data nobody reviews. The sheets pile up in a drawer, or the spreadsheet grows and no one opens it. Within weeks, entries get shorter, then stop. The fix is the weekly review with its fixed agenda — top three codes, one owner and one action each — held at the same time every week, with the crew present.
5. Using the log to blame the operator. The log is read as a record of who stopped the line, and the next week the entries dry up — or worse, stops go unlogged because logging them feels like confessing. The fix is structural: no blame code exists, the review talks about codes and minutes, and the first action after a bad week is aimed at the machine, the feeder, or the schedule — never at the person who wrote the line down.
A log is a measuring instrument, and like any instrument it has a range. Stating the range is part of using it honestly.
First, the log does not diagnose anything. It says the feeder jammed forty-two times; it does not say why. The why lives in the feeder, the tape, the reel, or the setup — and finding it is a separate job, with its own guides. A line that treats the log as a diagnosis will spend its review arguing about causes it has not investigated. The log’s job ends at the ranking; the investigation starts there.
Second, the log is not OEE. It feeds one part of the OEE calculation — the availability side, where stops are counted — and it says nothing about speed loss while the line is running, or about boards that fail inspection. The six classic losses behind OEE split across availability, performance, and quality, and this log covers the availability ones. Speed loss and quality loss need their own measurements. The OEE guide explains how the three parts fit together; this article only supplies the first part’s raw material.
Third, the paper log has a ceiling. It catches the stops people see and write down. It does not catch the line running ten percent below its normal rate for an hour, or the micro-stops that no one bothers to tally. When the weekly Pareto flattens — when the top codes shrink and the remaining loss hides in the performance side — that is the signal to move from paper to machine data: a counter, a sensor, or the machine’s own production records. The paper log is the right first step precisely because it teaches the line what to measure before it spends money measuring it.
Finally, the first week’s log is a baseline, not a verdict. There is no universal “good” downtime percentage and no acceptable number of stopped minutes per shift that applies to every line — a high-mix line with six changeovers a week and a single-product line running one job all month cannot be judged by the same number. The only honest comparison is the line against its own past weeks. If the top code’s minutes fall week over week, the log is working. If they do not, the action was wrong, and the next review says so.
The stops this log records happen on real machines, and the placement machine is where most of them happen on an SMT line. On the JHIMS product page for the Yamaha YSM40R placement machine, the listed placement challenges include exactly the stops this article’s codes are built for: frequent pickup errors causing nozzle wear, feeder jams, and unplanned downtime. Those are not abstract categories on that page — they are the named reasons a placement machine stops producing. In the log, they land under three codes: nozzle / pickup error, feeder jam / misfeed, and breakdown. When a line’s Pareto puts feeder jams at the top, the YSM40R page is the right place to look next for what the machine itself offers — feeder configuration, nozzle options, and placement-head choices — because the fix may be in the equipment, not in the operator.
One thing to be clear about: JHIMS does not sell a downtime-logging system, and no JHIMS machine is claimed here to log downtime by itself. The method in this article is paper or spreadsheet plus the machine’s own display and alarm messages as the source of stop times. What JHIMS supplies is the equipment whose stops the log records — placement machines, printers, and the rest of the line — and the product pages that describe them. The log belongs to the line’s own management; the machines belong in the log.
How long before the log shows anything useful?
One week is enough for the first Pareto, because the first Pareto only has to rank the codes, not prove a trend. Two or three weeks show whether the top code is a pattern or a bad week. Treat the first week as the baseline: it tells you where the line stands, and every week after it is measured against that week.
Should we log every stop, even a ten-second one?
No. Stops of a minute or two are tallied in aggregate under their code, with their total minutes added once per shift. One line per stop is for stops long enough to matter individually — the working rule is that anything the operator has to walk away from the machine to fix, or that takes more than a couple of minutes, gets its own line. The tally is what keeps the small stops visible without drowning the log.
Our changeovers are scheduled — why log them as downtime?
Because the line was scheduled to produce during that time and did not. This article follows the standard TPM position that changeover is an availability loss. The alternative — excluding changeovers — is also used by some factories, but it must be written down and applied the same way every week, or the numbers cannot be compared. Either convention works; a convention that moves does not.
What if the top code is “waiting for boards”?
Then the bottleneck is not on the line at all — it is in planning, kitting, or the upstream process. That is a useful finding, not a failure of the log: the log has just shown that fixing machines will not fix the week. The action belongs to production planning, and the code’s owner in the table says so.
When should we stop using paper?
When the weekly Pareto flattens and the remaining loss is in stops too short or too frequent to tally by hand, or when the line runs fast enough that manual logging misses more than it catches. Paper teaches the line what to measure; machine data takes over when the volume of stops outgrows the sheet. Until then, paper is not a compromise — it is the fastest way to start.
A line that cannot say where its hours went cannot fix where they went. The method is small on purpose: one line per stop, twelve codes, seven fields, logged at the machine at the time it happens, reviewed once a week by total minutes. The first week’s log is the baseline. The second week shows whether the top code is a pattern. The third week shows whether the fix worked. Everything else — the OEE number, the handover note, the next machine purchase — is built on those lines. Start with one sheet, one shift, one week, and let the ranking do the arguing.
Talk to JHIMS
For placement machines, printers, and the rest of the SMT line — and for the product pages behind this guide — contact us at [email protected].


 Teams
 whatsapp
 telegram
